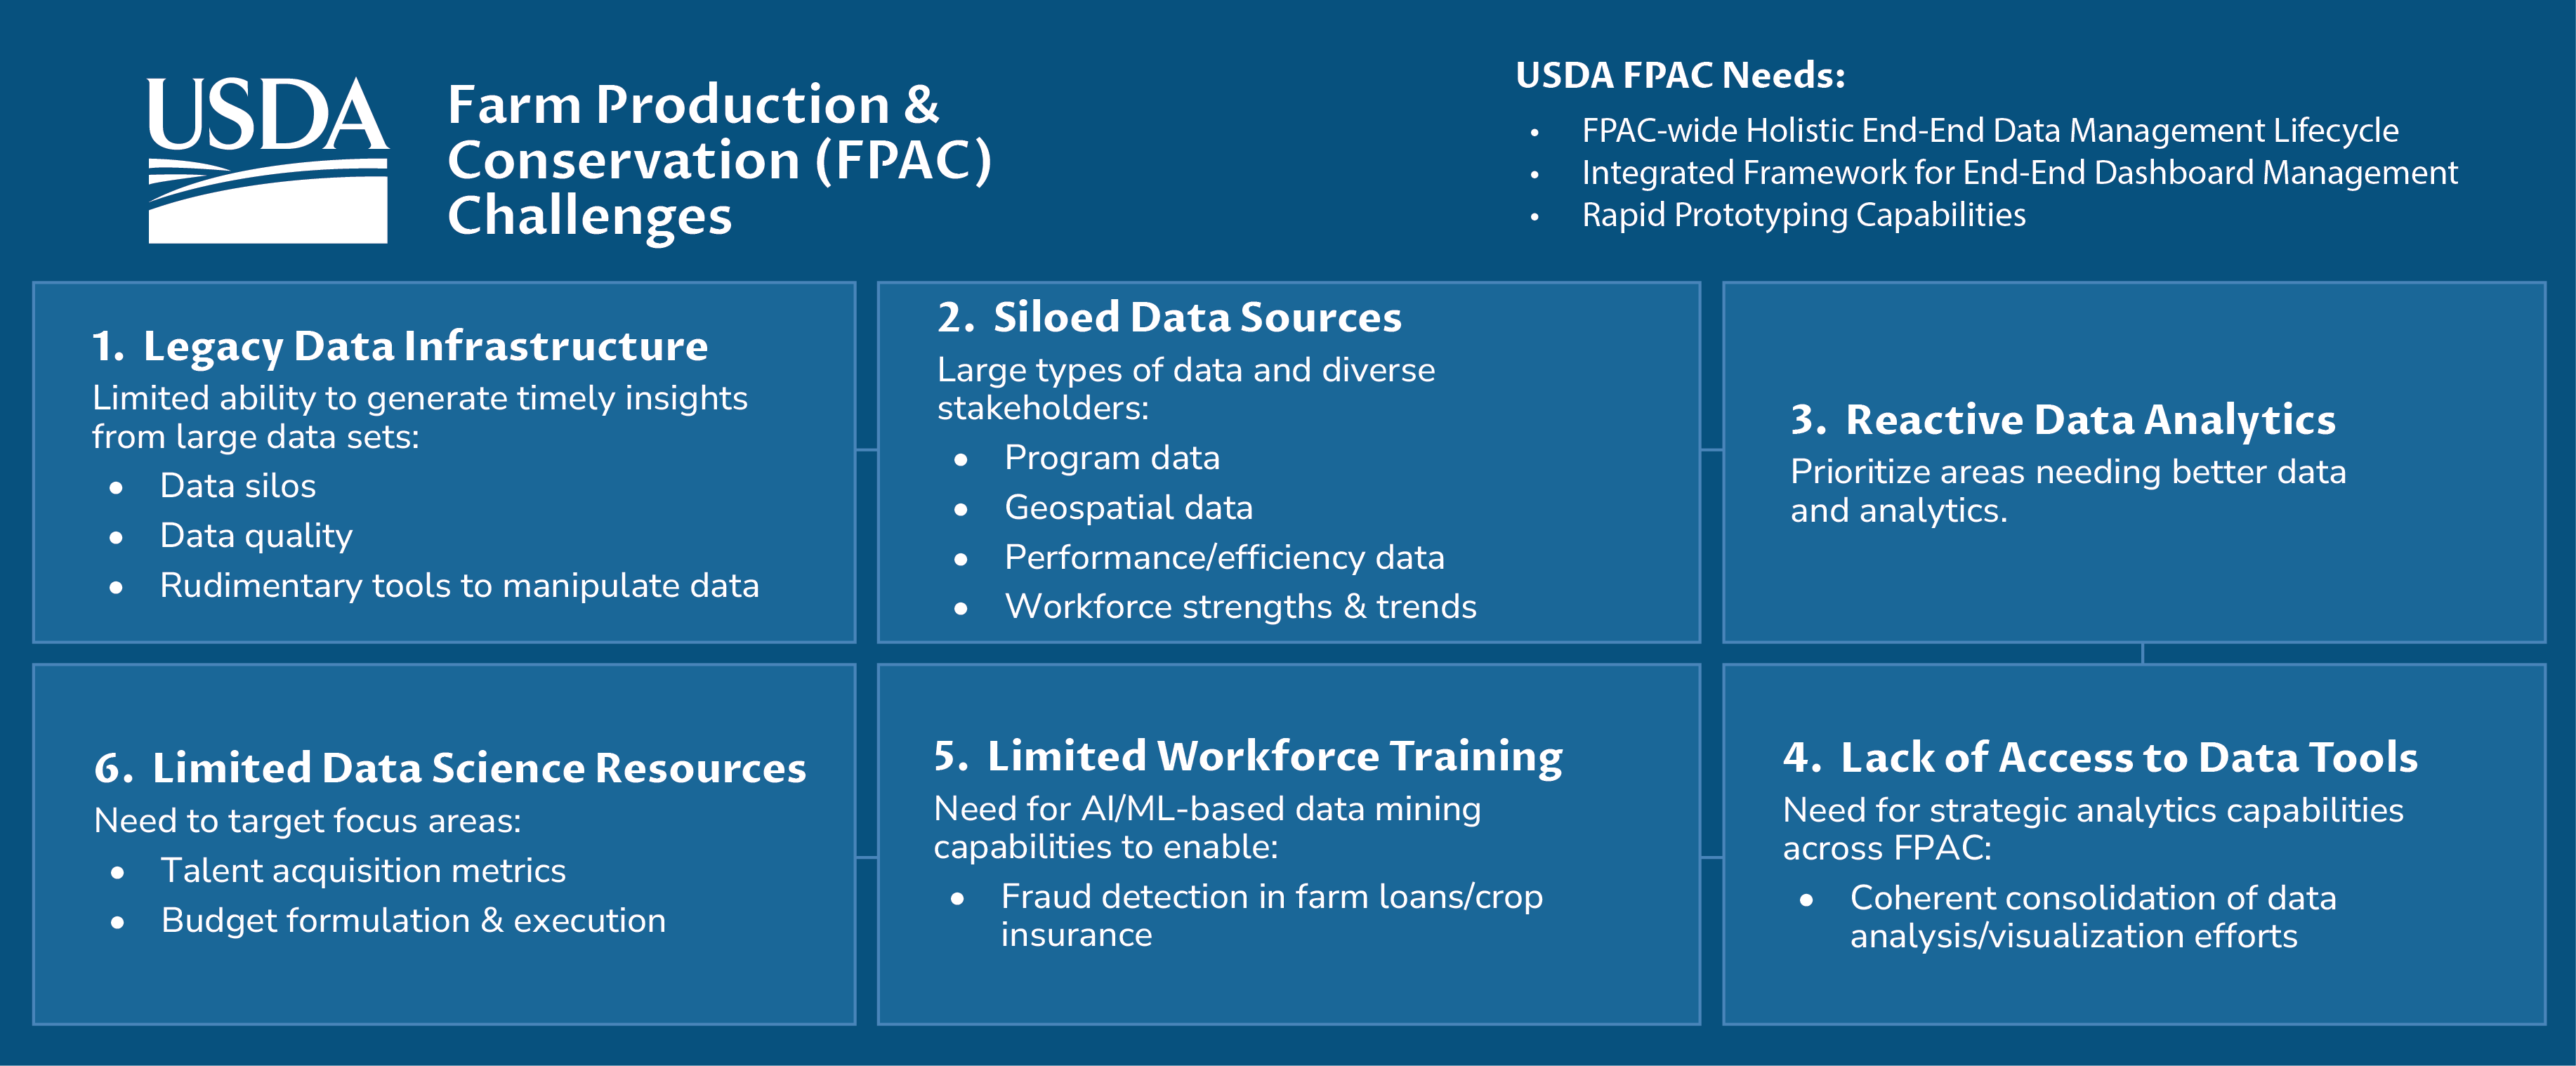
Visualizing Big Data
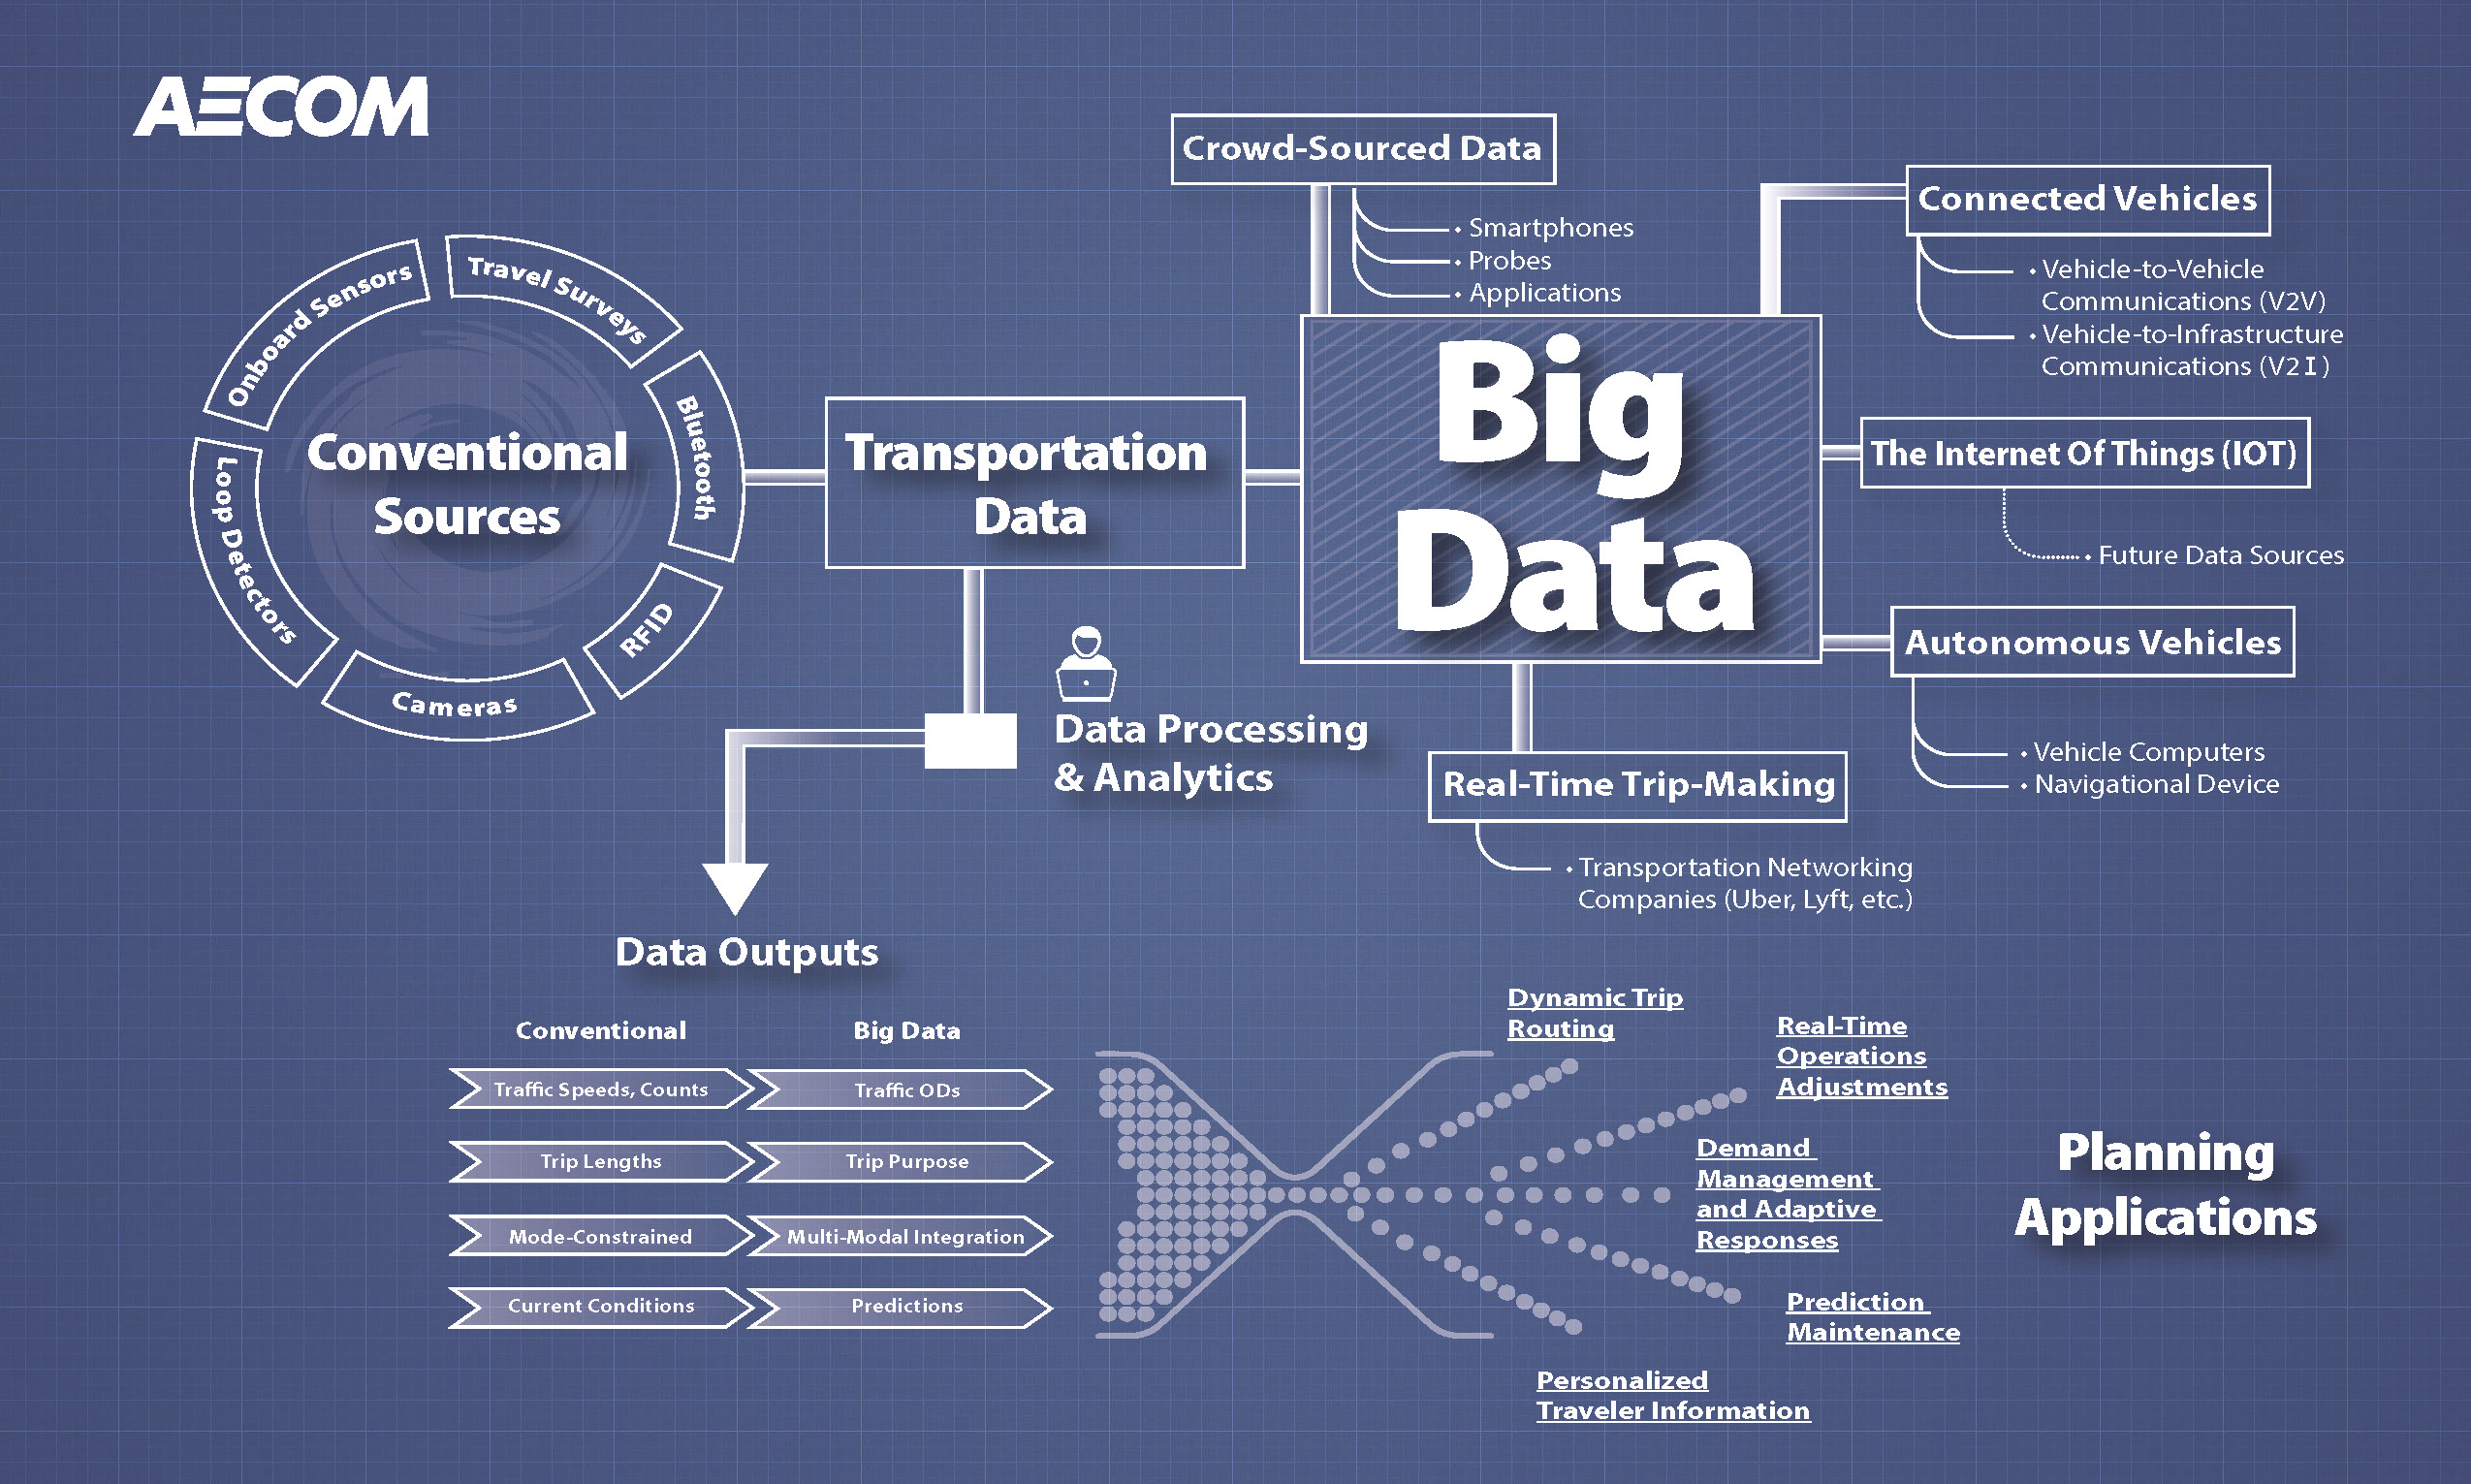
Visualizing Big Data Complex Systems, Clear Graphics.This infographic was built in Illustrator to visualize how conventional and emerging transportation data sources flow into real-time planning applications. From connected vehicles to crowd-sourced data, the design balances clarity with visual hierarchy—helping viewers quickly grasp relationships across systems. I used Illustrator’s shape-building tools and path controls to keep ... Read more